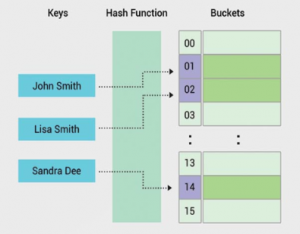
Describe a hash table
A hash table is a data structure that produces an associative array. A key is mapped to certain values through the use of a hash function. They are often used for tasks such as database indexing.

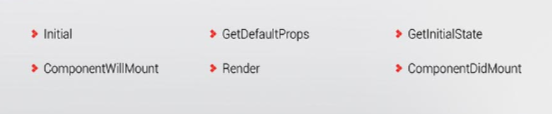
React has a Virtual DOM object, for each DOM object which acts as a representation for that original object. While updating DOM virtual DOM acts as the middle layer and only updates real DOM when there are any changes to virtual DOM. In that case react will update only the updated components and not the entire DOM.
AWS offers several methods to cost-effectively deliver live video content on the cloud. This answer provides an AWS solution that combines AWS Elemental Cloud, a service that enables customers to rapidly deploy multiscreen offerings for live and on-demand content, with other AWS services to build a highly resilent and scalable architecture that delivers your live content worldwide.
Namespacing is a technique employed to avoid collisions with other objects or variables in the global namespace. Its Important for helping organized blocks of functionality in the application into easily manageable groups which can be uniquely identified.
Supervised learning requires training labeled data. For example, in order to do classification (a supervised learning task), you’ll need to first label the data and need to train the model to classify data into your labeled groups. Unsupervised learning, in contrast, does not require labeling data explicitly.
Data mining is the extraction of implicit, formerly unknown, and potentially useful information from data. It is applied in a wide range of domains and its practices have become fundamental for several applications.
This article is about the tools used in real Data Mining for finding and describing structural patterns in data using Python. In recent years, Python has been used for the development of data-centric.
DATA IMPORTING AND VISUALIZATION
The very first step of a data analysis consists of obtaining the data and loading the data into the user’s work environment. User can easily download data using the following Python capability:
import urllib2
url = ‘http://aima.cs.devopspython.edu/data/iris.csv‘
u = urllib2.urlopen(url)
localFile = open(‘iris.csv”, ‘w’)
localFile.write(u.read())
localFile.close()
In the above snippet user has used the library urllib2 to access a file on the website and saved it to the disk using the methods of the File object provided by the standard library. The file contains the iris dataset, which is a multivariate dataset that consists of 50 samples from each of three species of Iris flowers. Each sample has four features that is the length and the width of sepal and petal, in centimetres.
The dataset is stored in the CSV format. It is appropriate to parse the CSV file and to store the informa tion that it contains using a more suitable data structure. The dataset has 5 rows, the first 4 rows contain the values of the features while the last row signifies the class of the samples. The CSV can be easily parsed using the function genfromtxt of the numpy library:
from numpy import genfromtxt, zeros
# read the first 4 columns
data = genfromtxt(‘iris.csv’,delimiter=’,’,usecols=(0,1,2,3))
# read the fifth column
target = genfromtxt(‘iris.csv’,delimiter=’,’,usecols=(4),dtype=str)
In the above example user has created a matrix with the features and a vector that contains the classes. The user can also confirm the size of the dataset looking at the shape of the data structures loaded:
print data.shape
(150, 4)
print target.shape
(150,)
print set(target) # build a collection of unique elements
set([‘setosa’, ‘versicolor’, ‘virginica’])
An important task when working with a new data is to understand what information the data contains and how it is structured. Visualization helps the user to explore the information graphically in such a way to gain understanding and insight into the data.
CLASSIFICATION
Classification is a data mining function that allocates samples in a dataset to target classes. The models that implement this function are called classifiers. There are two basic steps for using a classifiers: training and classification. The library sklearn contains the implementation of many models for classification.
t = zeros(len(target))
t[target == ‘setosa’] = 1
t[target == ‘versicolor’] = 2
t[target == ‘virginica’] = 3
The classification can be done with the predict method and it is easy to test it with one of the sample:
print classifier.predict(data[0])
[ 1.]
print t[0]
1
In this case the predicted class is equal to the correct one (setosa), but it is important to assess the classifier on a wider range of samples and to test it with data not used in the training process.
CLUSTERING
We do not have labels attached to the data that tell us the class of the samples. The user has to analyse the data in order to group them on the basis of a similar criteria where groups are sets of similar samples. This kind of analysis is called unsupervised data analysis. One of the most famous clustering tools is the k-means algorithm, which can be run as follows:
from sklearn.cluster import KMeans
kmeans = KMeans(k=3, init=’random’) # initialization
kmeans.fit(data) # actual execution
The snippet above runs the algorithm and groups the data in 3 clusters (as specified by the parameter k). Now the user can use the model to assign each sample to one of the clusters:
c = kmeans.predict(data)
And the user can evaluate the results of clustering, comparing it with the labels that they already have using the completeness and the homogeneity of the score:
from sklearn.metrics import completeness_score, homogeneity_score
print completeness_score(t,c)
0.7649861514489815
print homogeneity_score(t,c)
0.7514854021988338
The wholeness of the score approaches 1 when most of the data points that are members of a given class are elements of the same cluster while the homogeneity score approaches 1 when all the clusters contain almost only data points that are member of a single class.
The user can also visualize the result of the clustering and compare the assignments with the real labels visually:
figure()
subplot(211) # top figure with the real classes
plot(data[t==1,0],data[t==1,2],’bo’)
plot(data[t==2,0],data[t==2,2],’ro’)
plot(data[t==3,0],data[t==3,2],’go’)
subplot(212) # bottom figure with classes assigned automatically
plot(data[c==1,0],data[tt==1,2],’bo’,alpha=.7)
plot(data[c==2,0],data[tt==2,2],’go’,alpha=.7)
plot(data[c==0,0],data[tt==0,2],’mo’,alpha=.7)
show()

Despite the rapid adoption of cloud computing and its positive impact on business, there are still some myths and risks, concerns and misinformation around deploying and running applications in the cloud.
In this article we will be going to discuss the myths and the risks and provide the correct information and make you take an informed decision for your business or organization.
MYTH: EVERYTHING WORKS BETTER IN THE CLOUD
Cloud computing has its place in every business and organization, from multi-national corporations and financial institutions to online businesses and start-ups. The common profits of the cloud are faster time to market and streamlined processes and flexible infrastructure costs which are difficult to ignore. But just because the cloud has its place in every business, does not mean it is right for every task.
The public cloud might be best for some actions, private cloud for others, and dedicated hosting for legacy applications. Getting the right overall solution often requires a combination public, private, and dedicated infrastructure.
RISK: SECURITY RISKS AT THE VENDOR
When a cloud service vendor provides a critical service for your business and stores critical data – such as customer payment data and the mailing lists then you are placing the life of your business in the vendor’s hands.
Many small businesses know almost nothing about the people and technology behind the cloud services they use.
When the person is depending on a cloud service for their business-critical task, then they put the trust of their business into the hands of other people and the quality of their work.
The reputation is no longer depends on the integrity of only their business – now it also depends on the integrity of the vendor’s business. And that’s a cloud computing risk.
MYTH: DATA IS NOT AS SECURE IN THE CLOUD
A security breach could bring down your site and may cause the users to lose their valuable revenue. Therefore, it is not surprising that security concerns are one of the largest hurdles for many businesses considering the cloud. However, security is also one of the easiest cloud myths to debunk.
In reality, security risks in the cloud are the same as those faced by traditional IT solutions, but with one main difference: When operating in the cloud, security no longer rests on your shoulders alone. Instead, security is a shared responsibility with the cloud hosting provider.
RISK: RISKS RELATED TO LACK OF CONTROL
When the user host and maintain a service on a local network, then the user has complete control over the features he/she choose to use. However, when the user uses a cloud service provider, the vendor will have the control. The user has no guarantee that the features using today will be provided for the same price tomorrow or not. The vendor can double its price, and if the clients are depending on that service, then the user might be forced to pay. Also, who controls access to the user’s data in a cloud service? What happens if the user is not able to make payment?
If the user gets behind on their bill, then the user may be surprised to find their data is held hostage by the vendor. The user cannot access the service and export the data until he/she pay up.
MYTH: IT IS ALWAYS CHEAPER TO RUN IN THE CLOUD
It is not always cheaper to run in the cloud, but it can often be more cost effective. If you need all your servers running 24x7x365, it is likely you can get the same compute power for less cost using a dedicated server.
Cloud works best for variable demands and workloads, where you have higher demand at certain times and lower demand at others. The cloud allows to switch servers off during periods of lower demand to improve cost efficiency by more closely matching the cost pattern to the user’s revenue/demand pattern.
RISK: AVAILABILITY RISKS
No service can guarantee 100% uptime. When you rely on a cloud service for a business-critical task, then you are putting the feasibility of the business in the hands of two services: the cloud vendor and ISP.
If the user’s internet access goes down, then it will also take your vendor’s cloud service with it.
MYTH: CLOUD TECHNOLOGY IS STILL IN ITS INFANCY
A latest ISACA study revealed that cloud computing is fast approaching, within the next few years, you can expect to see constant innovation at an ever-increasing pace. Constant refinement will help to ensure that cloud computing meets the needs of every size and type of business. Those who harness the cloud now will be the first to reap its long-term rewards.